Benchmarks
Compare your XTB portfolio with the S&P 500
Your balance went up. Was that good picks, a rising market or simply new deposits? portfoliomanager separates the three.
Benchmarks
Your balance went up. Was that good picks, a rising market or simply new deposits? portfoliomanager separates the three.
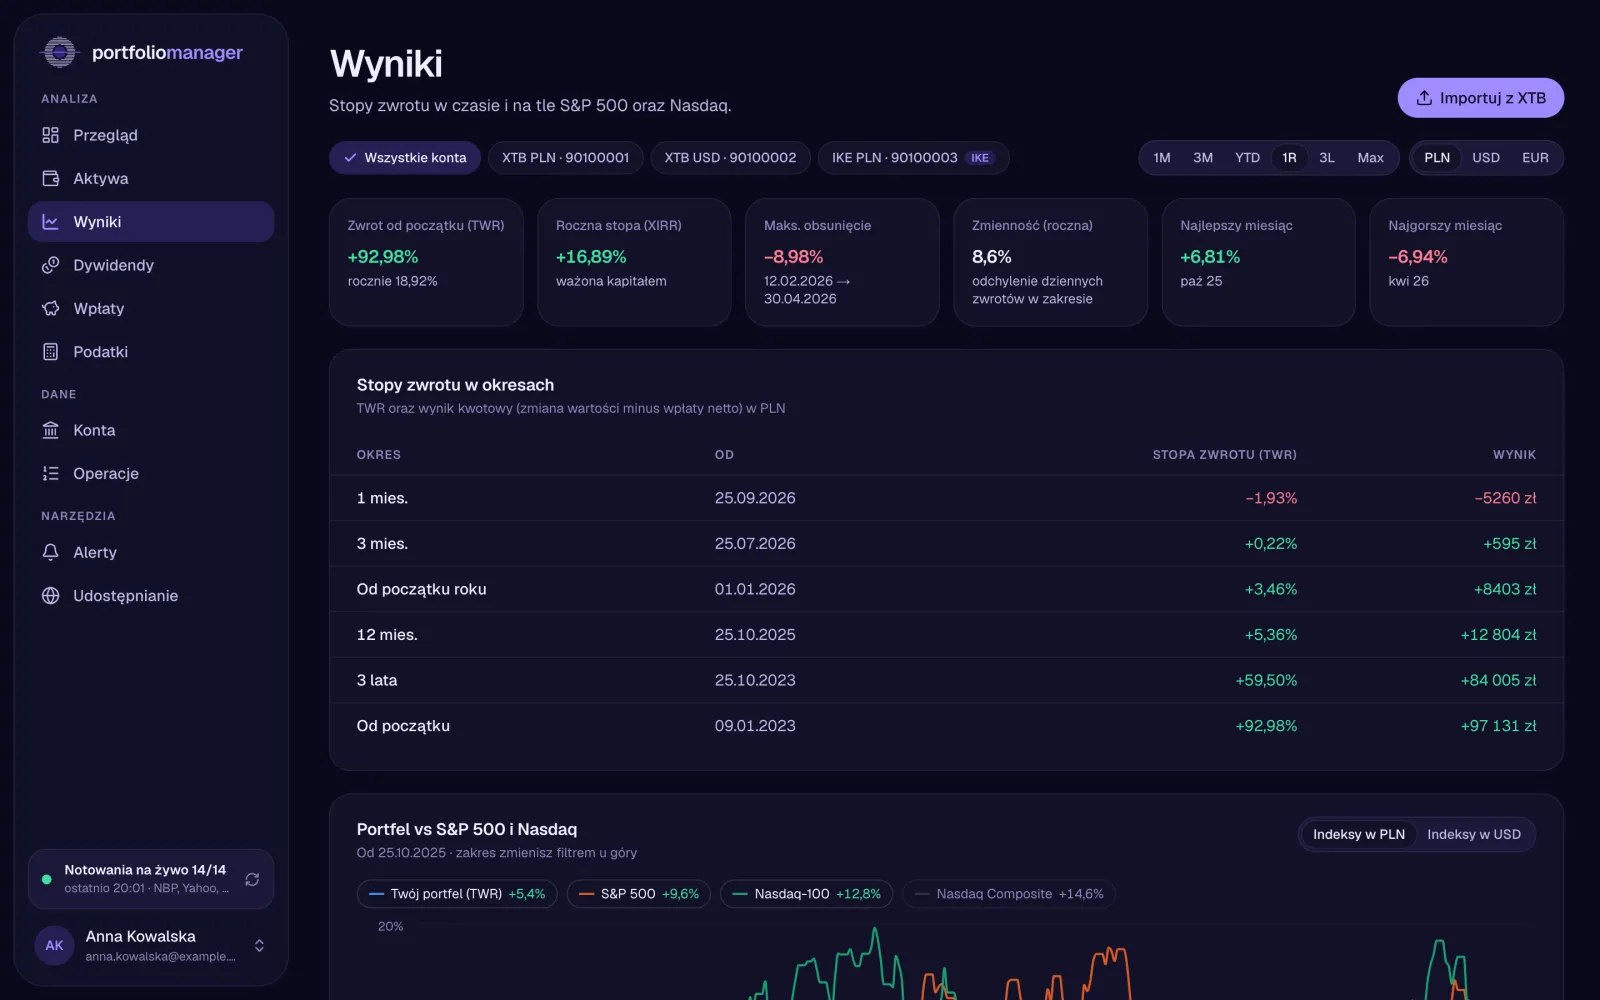
Time-weighted return (TWR) tells you how well your investments did, no matter when you added money. It is the figure to compare with an index.
XIRR tells you what your money earned per year, taking the timing and size of every deposit into account. It is the figure to compare with a savings account or a bond.
The S&P 500, the Nasdaq-100 and the Nasdaq Composite are converted at NBP rates to PLN, USD or EUR. A Polish investor holding US shares carries currency risk, and a fair benchmark should carry it as well.
The simulation takes your portfolio value at the start of the period plus every later deposit and withdrawal, and invests them in the index on the same days. The difference shows what your own choices added or cost.
Since January 2023 the demo portfolio returned +93.0% time-weighted, against +50.2% for the S&P 500 and +97.7% for the Nasdaq-100, all measured in PLN.
The S&P 500, the Nasdaq-100 and the Nasdaq Composite.
Yes: 1 month, 3 months, year to date, 1 year, 3 years or since the first deposit.
xStation shows the profit on open positions. portfoliomanager measures the whole account over time, including closed positions, dividends, fees and currency effects.
Free for every XTB investor.
Start for free